
Weekly chart
Optimistic outlooks regarding the weekly chart. The 50% Fibonacci-level has held it and now it is already above the 200 weeks exponential moving average. All the indicators are signaling a bullish trend. Weekly target is 90$ at the former top.
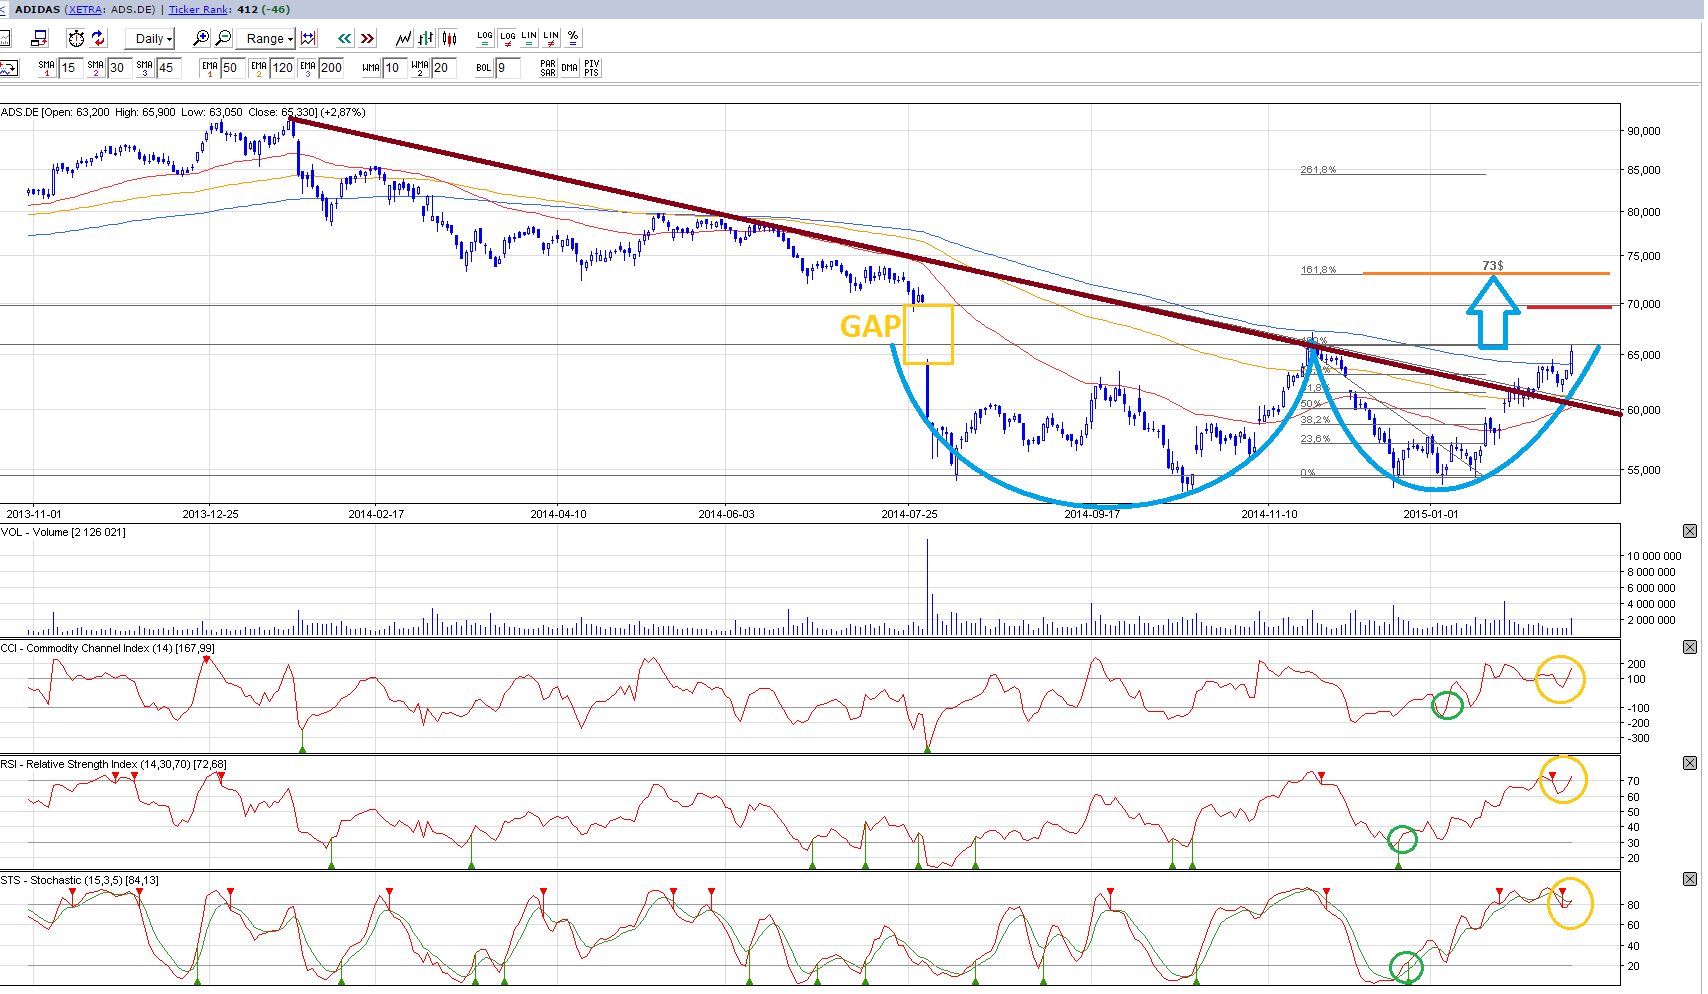
Daily chart
The daily chart looks also nice! Double dip (bullish) with 73$ target price could be a good guess. But before that it should fill the big gap under 70$. This could be a resistance level, be careful! The big brown trendline has been breached and tested after. It should act like a strong support in the future. The indicators are already extremly hot, but the sell signals have been cancelled lately. The double dip’s neckline at this level is also a hard level to break.
